- Home
- Artificial Grass
- Turf Specs Comparison Guide
Compare Turf Specs
Turf Specs Comparison Guide
Compare artificial turf products using the key specs and features that impact performance, comfort, and long-term results.
Understand what actually matters—so you can choose the right turf with confidence.
Start here
How to Evaluate Artificial Turf
Not all turf is created equal—but most differences come down to a handful of measurable factors.
This page breaks down the core standards used across the industry so you can:
- Compare products objectively
- Understand tradeoffs
- Make confident decisions
System Specs
Turf Is a System—Not a Product
Artificial turf performance comes from how multiple components work together:
Industry standards measure the outcome of this system—not just individual materials.
That’s why two products with similar specs can perform very differently once installed.
System Measurements, Not Products
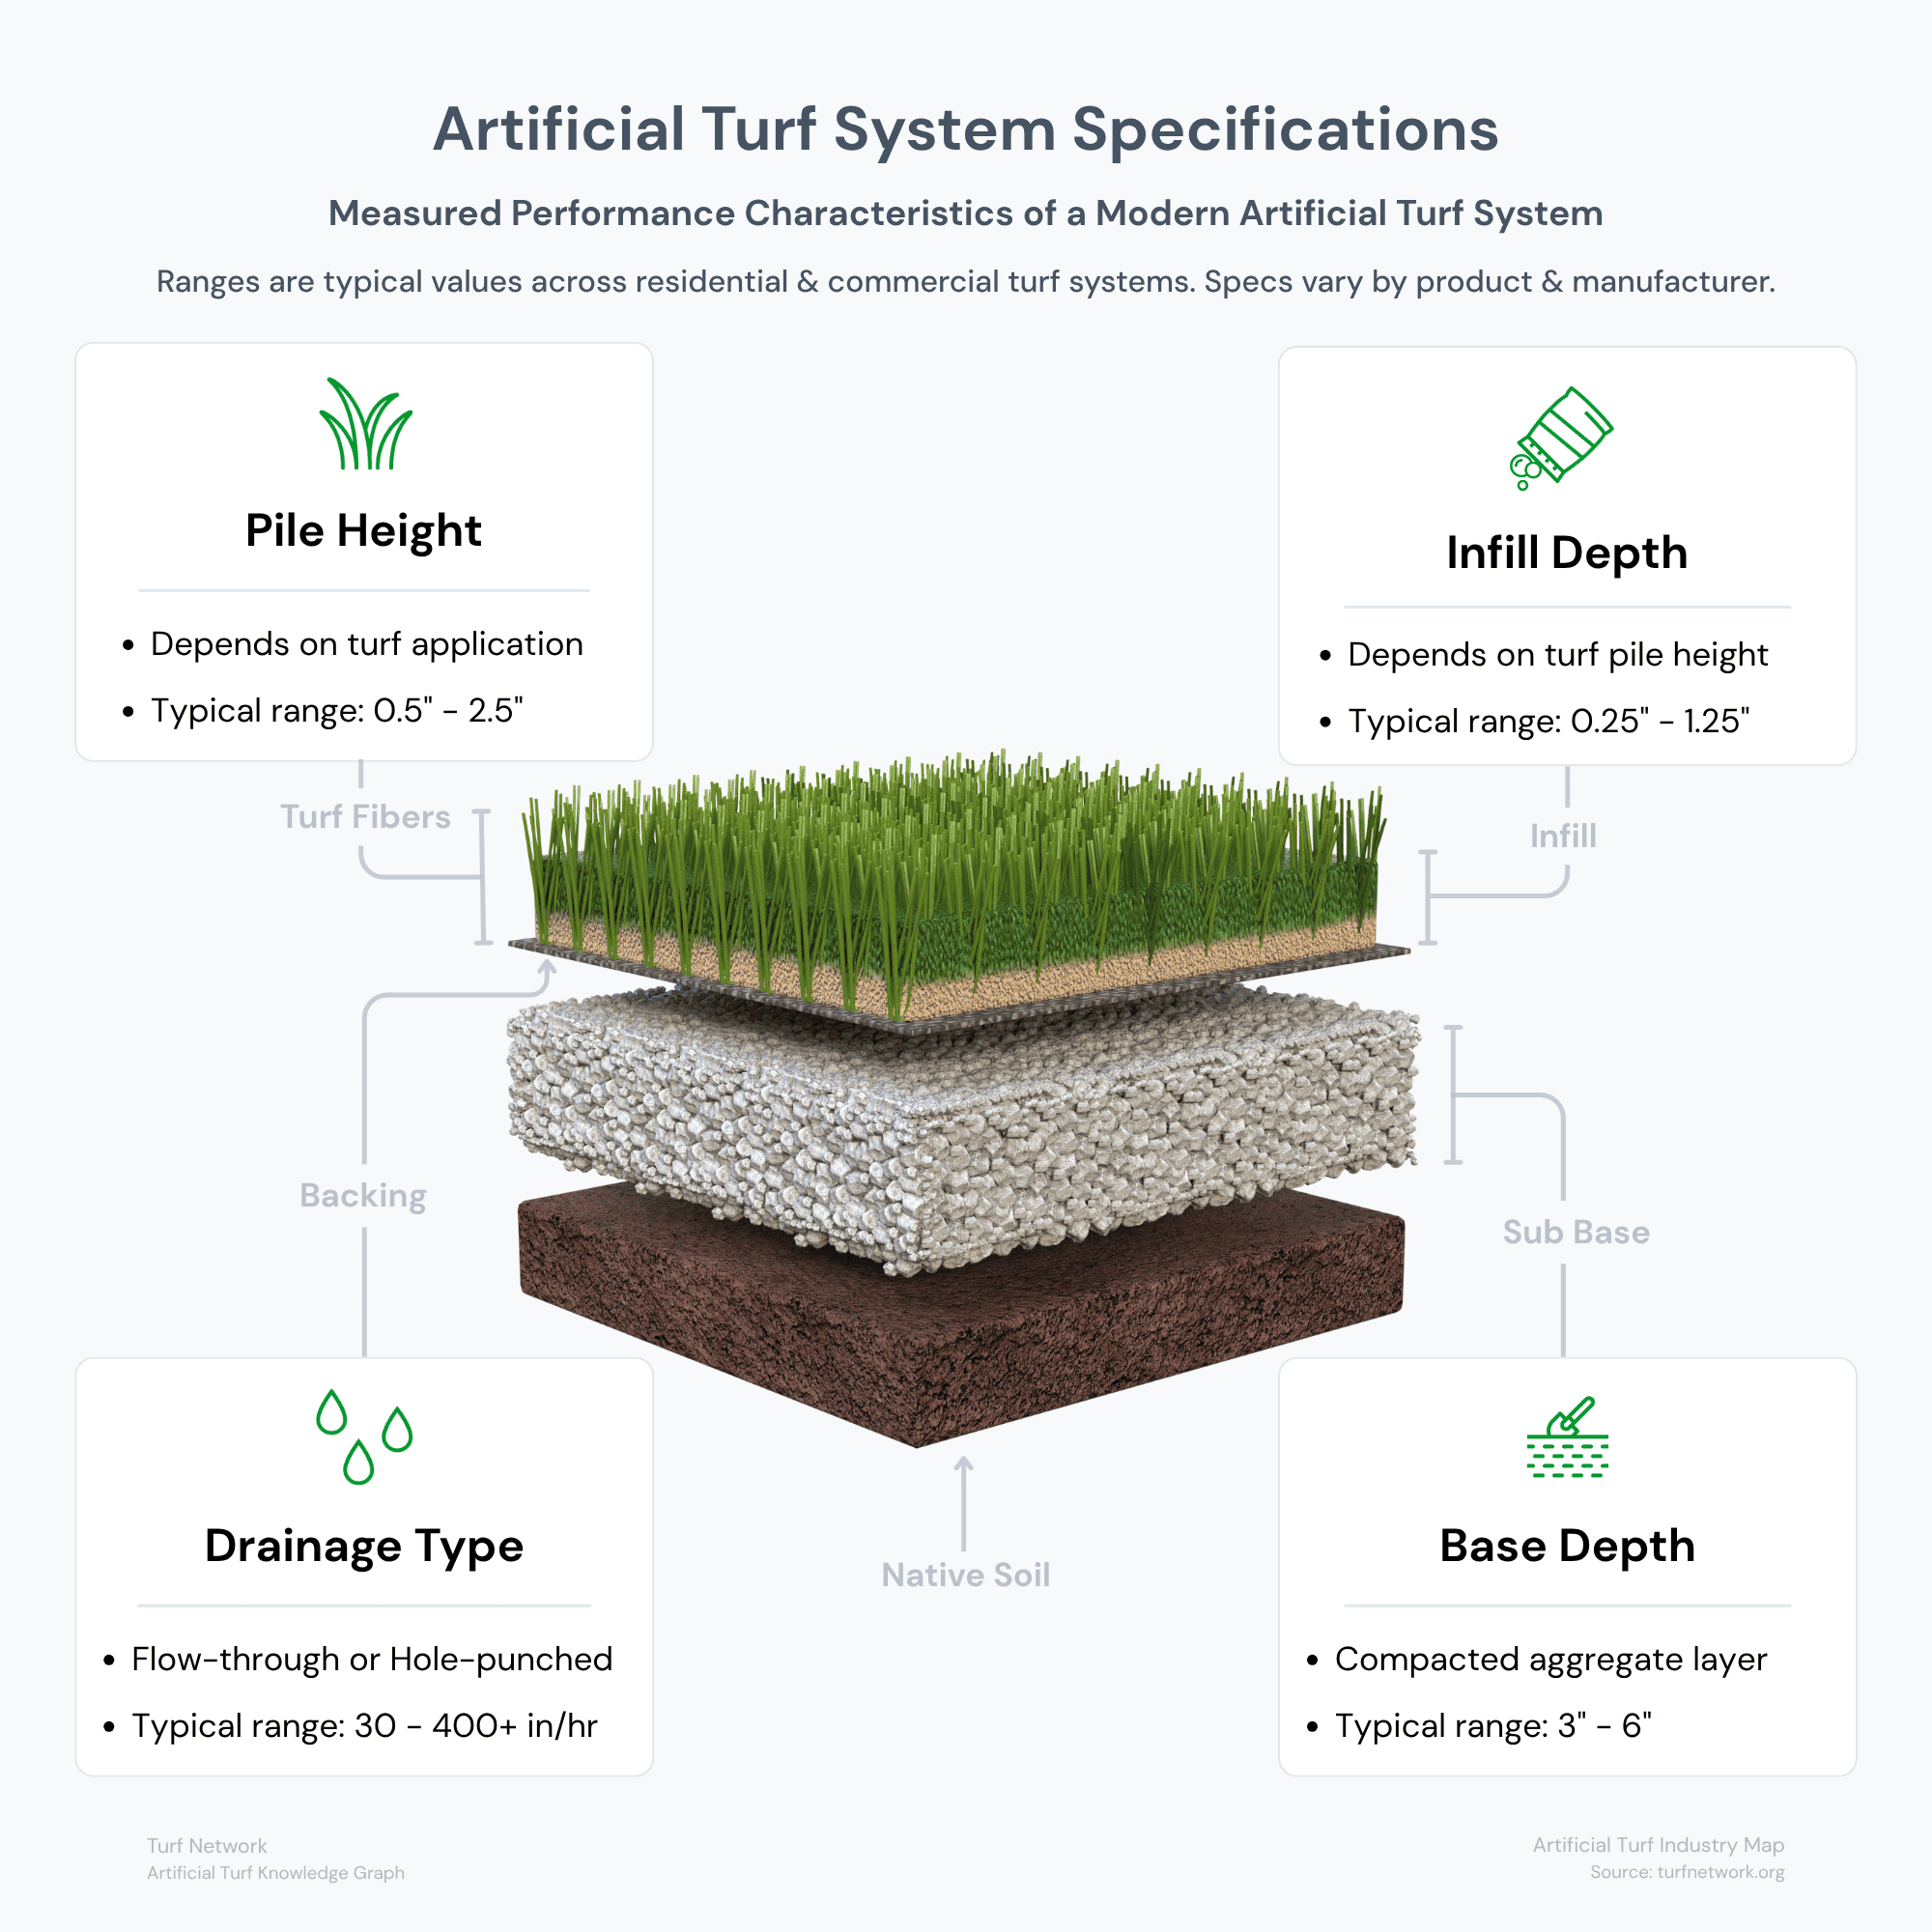
Artificial turf system specifications quantify how pile height, infill depth, drainage type, and base depth interact to determine surface performance, durability, drainage capacity, and long-term stability.
Turf Network — Artificial Turf System Components
Source: Turf Network – turfnetwork.org/artificial-grass/compare-turf-specs/
System Specs
Core Turf System Measurements
These are the primary metrics used to define how turf looks, feels, and performs.
Face Weight
Fiber Density
Range: 40 – 100+ oz/sq yd
Indicates how much fiber is used in the turf.
Impacts surface durability and fullness.
Pile Height
Blade Length
Range: 0.5″ – 2.5″
Height of the turf fibers measured from backing.
Impacts appearance, softness, & intended use.
Stitch Rate
Rows Per Inch
Range: 0.25″ – 1.25″
How closely fibers are stitched into the backing.
Affects fiber density & durability.
Total Weight
System Weight
Range: 60 – 120+ oz/sq yd
Includes fiber + backing weight.
Helps indicate overall material quality.
Backing Type
Structural Layer
Range: Polyurethane / Latex
Holds fibers in place & affects drainage, durability, & environmental resistance.
Drainage Rate
Drainage Capacity
Range: 30 – 1K+ inches/hour
Measures how quickly water passes through the backing & into the sub-base.
Infill Depth
Support Layer
Range: 0.25″ – 1.25″
Controls stability, cushioning, and fiber support—not just “fill.”
Base Depth
System Foundation
Range: 3″ – 6″
Compacted layer of crushed aggregate. The foundation of a turf system.
Key Features
Key Artificial Turf Features
How turf feels, performs, and functions in real-world use.
The features below are in groups of 3, organized from top to bottom by:
Performance, Comfort, Functionality
Performance
Durability
- Determines performance under long-term use and environmental exposure
- Influenced by fiber strength, backing quality, and system construction
Resilience
- Fibers return upright after use, maintaining a natural appearance
- Helps prevent matting and flattening in high-traffic areas
Wear Resistance
- Holds up against repeated foot traffic without excessive fiber breakdown
- Maintains structure and performance over time in heavy-use environments
Comfort
Softness
- Determines how comfortable the surface feels underfoot or contact
- Influenced by fiber shape, thickness, and overall turf construction
Cooling / Heat Reduction
- Helps minimize surface temperature in direct sunlight
- Influenced by fiber color, materials, and cooling infill technologies
Cushioning
- Absorbs impact to reduce stress on joints and improve comfort
- Enhanced by infill, padding, and underlying system layers
Functionality
Antimicrobial Protection
- Helps reduce odor and bacterial buildup within the turf system
- Common in pet applications and high-moisture environments
UV Protection
- Resists fading and degradation from prolonged sun exposure
- Maintains color and structural integrity over time
Drainage Performance
- Allows water to pass through the turf system efficiently, preventing pooling
- Depends on backing design, perforation, and base preparation
Feature Comparison
Compare Key Turf Features
Understand how each feature influences comfort, durability, drainage, and long-term performance across different turf applications.
| Feature | What It Affects | Why It Matters | Where It Matters Most |
|---|---|---|---|
|
Resilience
Recovery
|
Appearance, recovery, fiber memory | Keeps turf looking upright and natural after repeated use | Lawns, pet turf, moderate-to-high traffic areas |
|
Wear Resistance
Durability
|
Longevity, structure, surface retention | Helps prevent fiber breakdown in high-use environments | Playgrounds, sports fields, commercial spaces |
|
Softness
Comfort
|
Surface feel, barefoot comfort, usability | Improves day-to-day comfort for walking, sitting, and play | Residential lawns, pet areas, family spaces |
|
Cushioning
Impact
|
Impact absorption, joint stress, safety | Reduces force underfoot and improves comfort during use | Playgrounds, sports systems, pet-friendly installations |
|
Drainage
Function
|
Water flow, usability after rain, hygiene | Prevents pooling and helps the surface dry faster | All applications, especially pets and heavy-rain regions |
|
Heat Reduction
Temperature
|
Surface temperature, warm-weather usability | Helps reduce heat buildup in direct sunlight | Residential lawns, playgrounds, hot climates |
|
UV Stability
Protection
|
Color retention, lifespan, structural integrity | Helps turf resist fading and sun-related material breakdown | All outdoor installations |
|
Antimicrobial Protection
Hygiene
|
Odor control, bacterial resistance, cleanliness | Helps reduce odor and microbial buildup in the turf system | Pet turf, moist environments, high-use surfaces |
These features should be evaluated together. Performance depends on the full turf system, including fiber construction, backing, infill, and base preparation.
Product Specs
Core Turf Product Specifications
Artificial turf products are defined by a consistent set of technical specifications.
These metrics describe fiber characteristics, density, and construction details that impact performance and durability.
Fiber / Yarn
Material: Polyethylene, Polypropylene, or Nylon
Shape: Blade profile (C, W, Diamond)
Denier: Fiber thickness measurement
Surface Construction
Pile Height: Fiber length (inches or mm)
Face Weight: oz per sq yd
Stitch Rate: Rows and stitch density
Backing System
Primary Backing: Fiber anchor layer
Secondary Backing: Polyurethane or latex coating
Tuft Bind: Fiber pull strength
Infill System
Type: Sand, Coated Sand, Organic, Rubber
Depth: Fill height between fibers
Weight: lbs per sq ft
Application Guidelines
Recommended Turf Specs by Application
Different applications require different performance priorities.
Dogs & Pets
Pile Height: 1.0″ – 1.5″
Drainage: High permeability
Focus: Cleanability and durability
Putting Greens
Pile Height: 0.3″ – 0.75″
Fiber Type: Nylon or PP
Focus: Ball roll and surface consistency
Playgrounds
Pile Height: 1.25″ – 2.0″
Padding: Shock pad required
Focus: Safety and impact absorption
How to Use this page
How to Compare Turf Products
These measurements are not about finding the “highest number.”
They’re about finding the right balance for your application.
For example:
- A backyard lawn prioritizes comfort and appearance
- A sports field prioritizes durability and performance
- A pet area prioritizes drainage and sanitation
The same metric can mean something different depending on how the turf is used.
Understanding that context is what separates a good decision from an expensive mistake.
Misconceptions
Common Misconceptions
Click a title below to open the accordion:
“Higher face weight = better turf”
Not always. Density must be balanced with stitch rate and fiber type.
“All turf drains the same”
Drainage varies significantly based on backing and base construction.
“Infill is optional”
Infill plays a critical role in performance, stability, and longevity.
“Warranty reflects performance”
Warranties often reflect manufacturing—not real-world installation conditions.
System Components
How These Standards Relate to Turf System Components
To better understand how each part of a turf system contributes to performance, explore the individual components below.
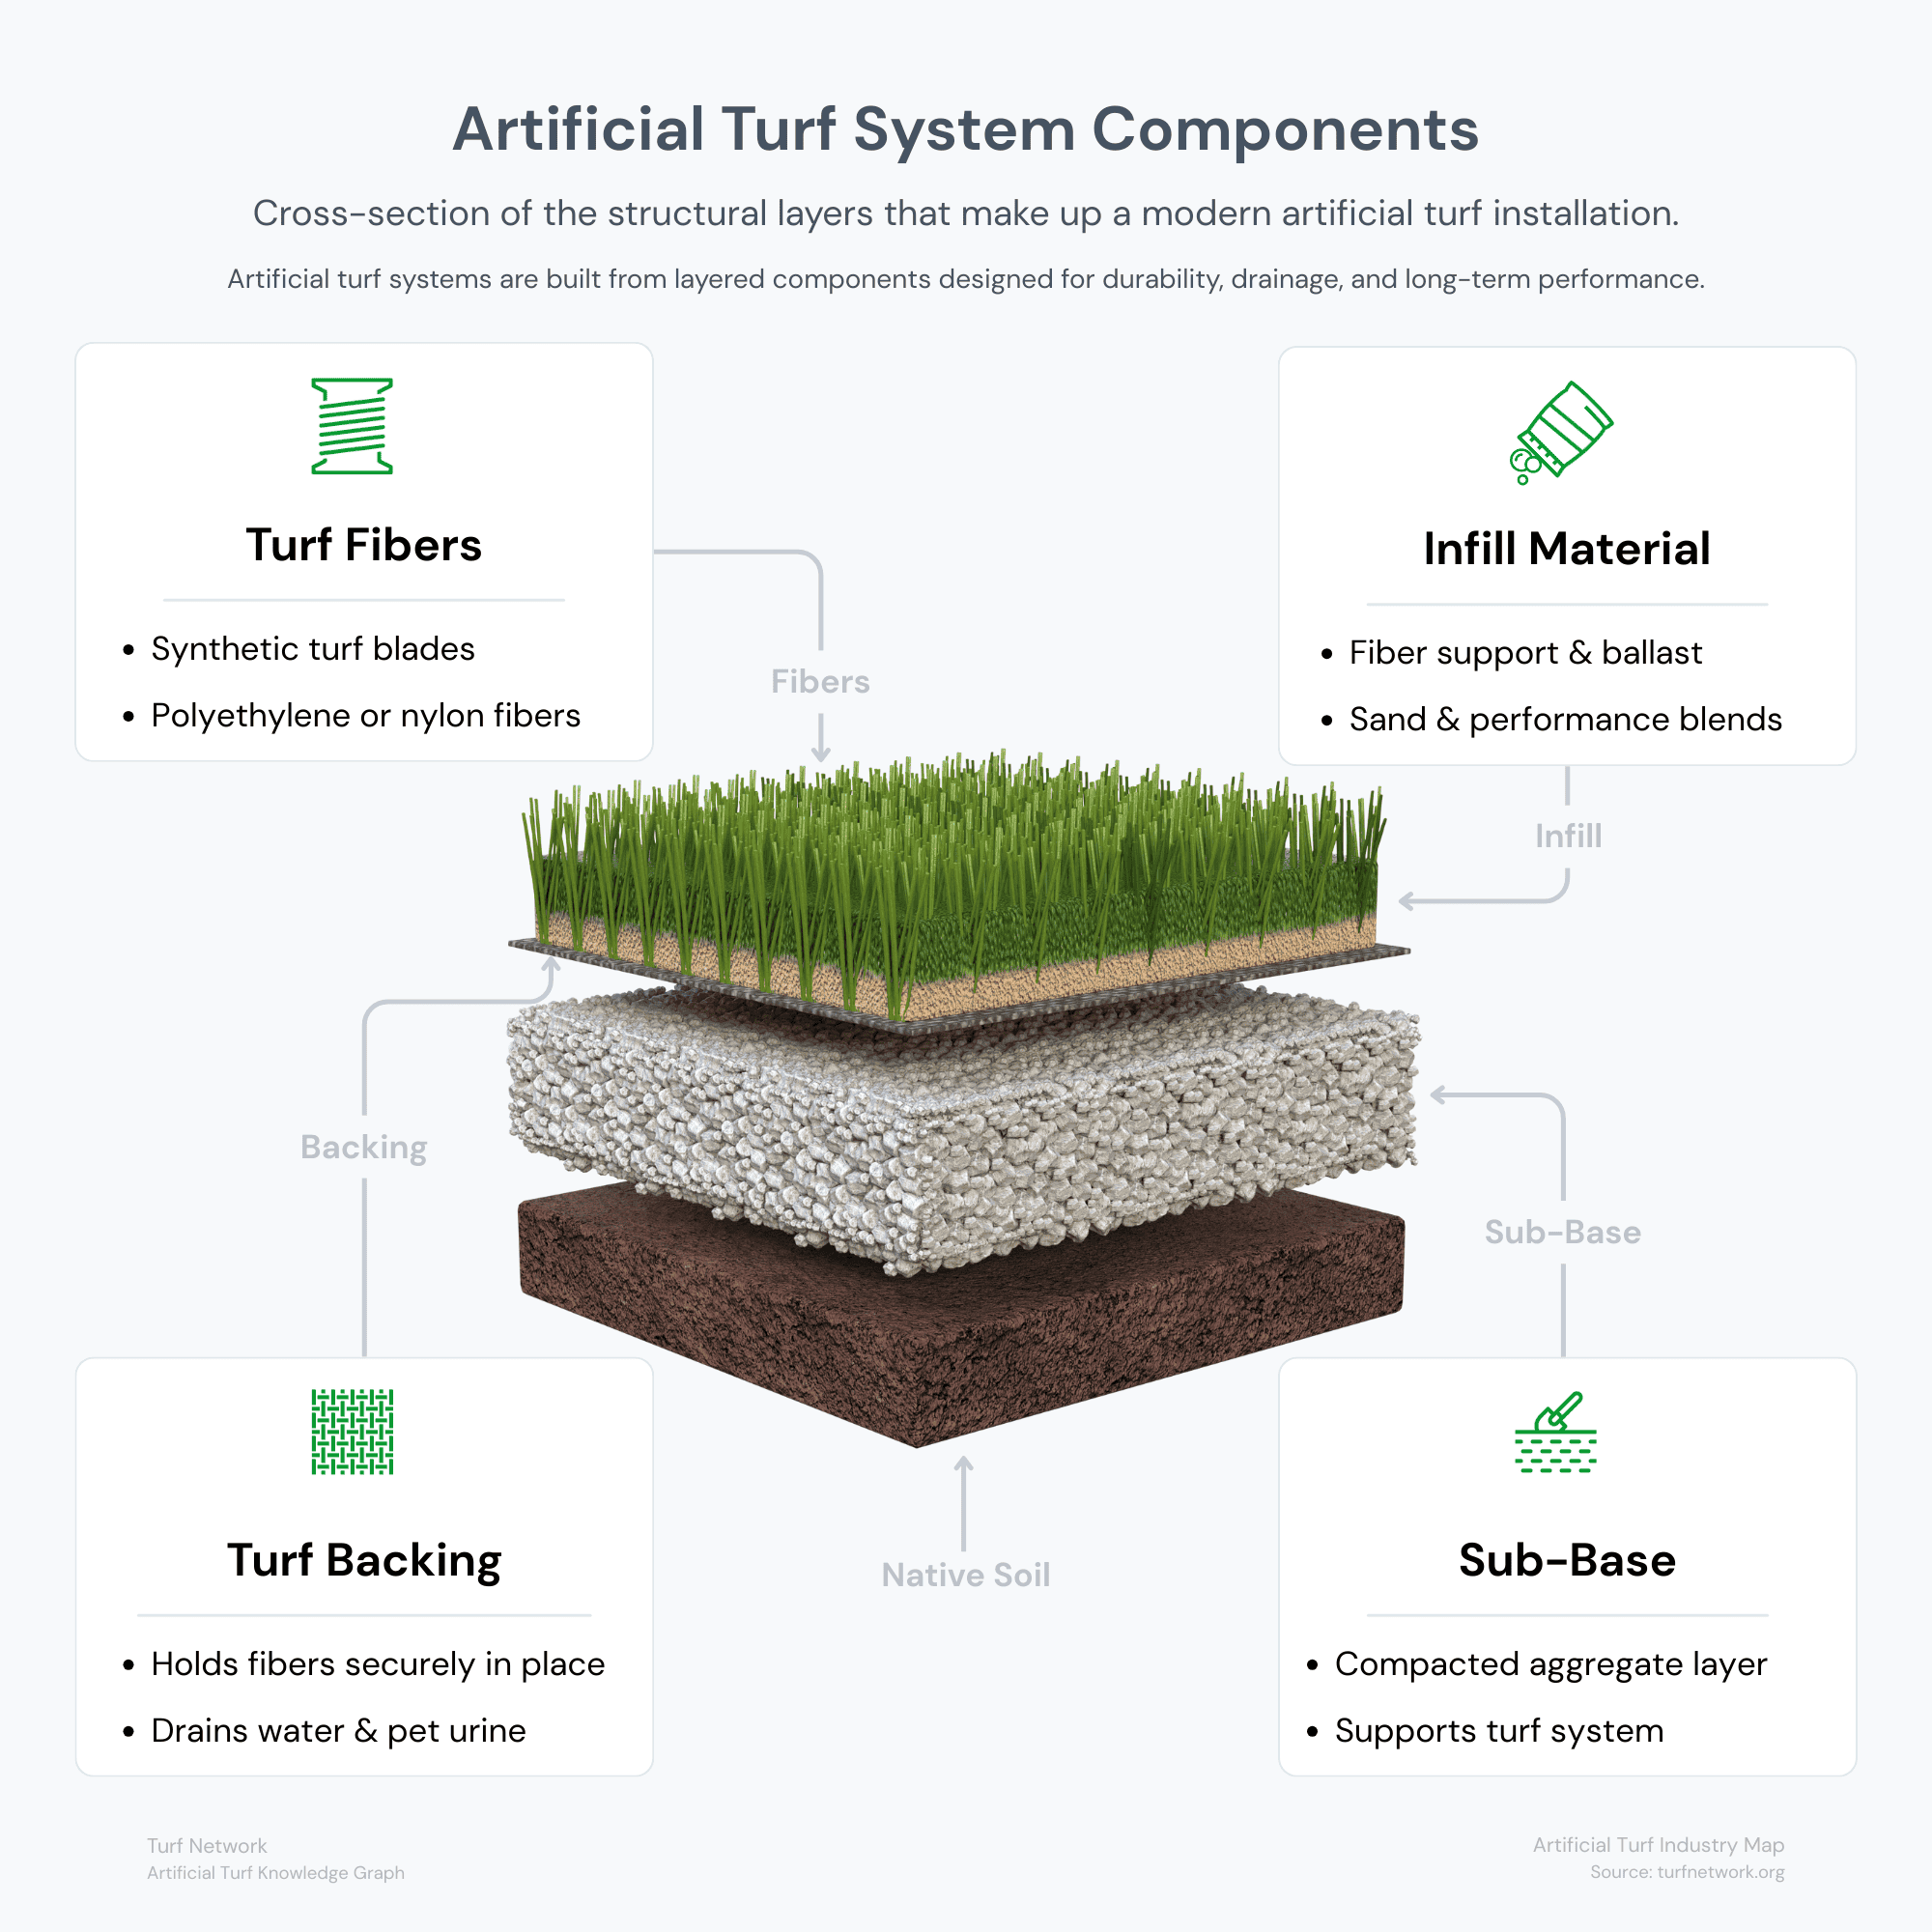
The diagram illustrates the primary components of an artificial turf system and how each layer contributes to overall performance.
Turf Network — Artificial Turf Industry Map
Source: Turf Network – turfnetwork.org/artificial-turf-industry/
Need Help Comparing Turf Options?
Explore products, compare providers, and find the right fit for your project.